Results
Material removal
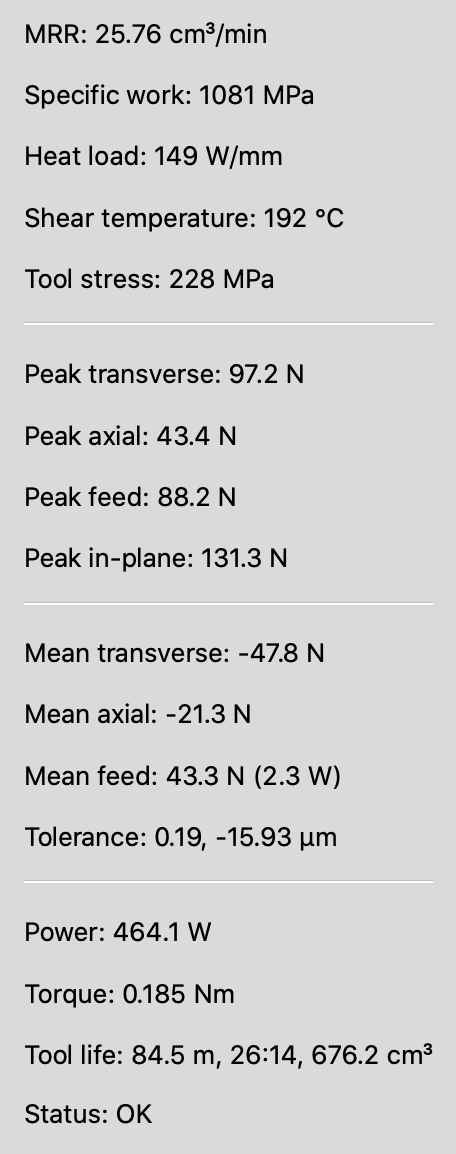
At the top of the list, the material removal rate is shown for reference. Just below is the specific work, that is, how much energy is expended per volume of material removed. (The unit for this quantity is nominally a pressure because work/volume has the same unit as force/area.) Note that this value is not a material constant but changes with cutting conditions: It can be seen as a type of efficiency. The lower the specific work, the less energy is expended to perform a given machining task.
Heat load is the amount of mechanical power converted to heat, divided by the length of engaged cutting edges, averaged over one revolution. It is therefore a measure of how much the tool is likely to heat up locally, should the operation be maintained for long.
Shear temperature is the computed temperature in the zone of the workpiece where most of the shear deformation occurs. This is not the temperature of the tool.
Power and torque
Power and torque values shown here are correspond to the mechanical output the the spindle needs to generate at the tool. There are always mechanical losses due to friction and, for geared spindles, power transmission efficiency, that must be added to this value to obtain the required spindle power.
Millalyzer computes the torque from the tangential force components over one revolution, and power from torque and spindle speed [N], not torque from empirical power rules.
Tool stress and tool life
Just below the tool selection, the nominal stiffness of the tool alone is shown for the current value of exposed length (stick-out). This is intended to give users of millalyzer static an approximate indication of the flexibility that is caused by the tool itself. Naturally, the stiffness of the assembly, including tool-holder, spindle and work-holding, must always be (sometimes very much) smaller.
The forces generated by the engaged cutting edges create bending and twisting moments along the tool axis. These result in a small deformation of the tool from which internal stresses are computed using representative endmill geometries. The highest van-Mises-stress observed in any one point during a full revolution is displayed as approximate tool stress. Maximum stress is often reached is often near the top end of a flute where the bending moment is large and the cross-section still weakened. Tools with small shaft diameter may also be vulnerable at the transition to the tool holder when the exposed length is long.
High tool stress leads to metal fatigue, which shortens tool life. But even with low stresses, tools will wear on the flanks and rake faces. Tool life as limited by both factors is displayed in terms of cutting length, duration and material volume removed.
More details can be found on the tool life page.
Forces and deflection
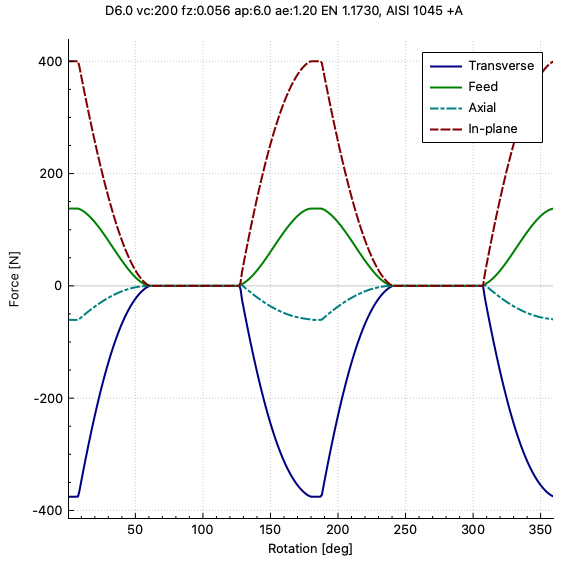
Peak forces are the highest values attained during a tool revolution. These can be very much higher than the mean values whenever the radial engagement is small or when using one- or two-flute tools. This is because, under some conditions such as the one shown in the plot below, the cutting edges move in and out of the cut so that sometimes, no edge is engaged.
Peak forces are important because they play a role in chatter and determine the highest stress that the tool will experience in each revolution. This tends to be very relevant for small-diameter solid tools which are relatively easy to overload.
Mean forces are just the averages encountered over one revolution. These values determine which thrust the drives need to deliver and control the mean tool deflection.
In the row labeled tolerance, there are two values which characterize the accuracy that can be obtained. The first (here: 0.13 µm) is the height of the vertical wall scalloping marks - this is purely a function of feed per tooth and tool diameter and can only be reduced by lowering the feed per tooth. Scalloping is negligible in this example, but can be significant with indexable cutters that are used with much larger feed values. The second value, which is much larger here, is the transverse tool deflection that would result from the mean forces.
Example
When boring a 10 mm diameter hole with the results shown here, we would expect that the actual diameter is 2 × 15 µm = 30 µm undersize, because the value displayed is negative, that is, deflection away from the wall. It would be advisable to repeat the operation with a mush lighter finishing pass in order to achieve a better tolerance.
On the right, the plot shows the development of force components over one revolution. An explanation of the coordinate system and force directions can be found on the theory page. To see the precise value at one particular time, click on that point in the graph and the values will be displayed in the lower-left corner.